


In the dynamic landscape of New Zealand's property market, data is the new currency. Yet, possessing data and possessing insight are two vastly different things. I've witnessed too many astute executives and investors make multi-million dollar decisions based on headline figures or gut feel, only to be blindsided by underlying market currents. The true power lies not in the data itself, but in a structured, analytical framework that transforms raw numbers into a strategic compass. This guide is designed to move you from passive observer to active analyst, equipping you with the methodologies to decode market signals and secure a formidable competitive advantage.
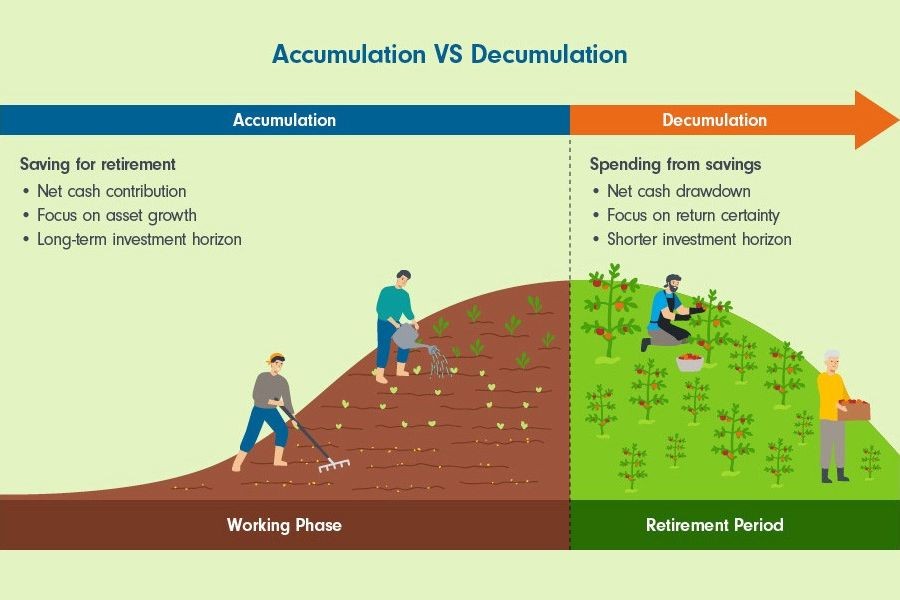
Deconstructing the Data Ecosystem: From Macro to Micro
Effective analysis begins with understanding the hierarchy of data. Think of it as a pyramid: at the base are the broad, macroeconomic forces; at the peak, the hyper-local, property-specific details. Skipping layers leads to flawed conclusions.
The Foundational Layer: Macroeconomic & Policy Drivers
This is the 'why' behind market movements. Ignoring this layer is like sailing without checking the weather forecast.
- Official Cash Rate (OCR) & Mortgage Rates: The Reserve Bank of New Zealand's (RBNZ) OCR decisions are the single most powerful lever on property affordability and investor appetite. Track the RBNZ's Monetary Policy Statements and forecasts religiously.
- Net Migration: Stats NZ data is crucial. For instance, the record net migration gain of 139,000 in the year to December 2023 created immediate pressure on rental markets and housing demand, a trend with a 12-18 month lag effect on prices. From consulting with local businesses in New Zealand, I've seen developers use this data to time project launches perfectly.
- Government Policy: Bright-line test changes, interest deductibility rules, and the First Home Grant caps directly alter investor and buyer behavior. The recent reintroduction of interest deductibility for new builds, for example, is a clear signal channeling investment toward new supply.
- Employment & Wage Growth (Stats NZ): Strong wage growth in specific regions (e.g., Bay of Plenty post-COVID) can signal rising local purchasing power and price resilience.
The Market Performance Layer: Core Valuation Metrics
Here, we move from drivers to outcomes. Rely on a basket of metrics, not just one.
- REINZ House Price Index (HPI): Prefer this over median price. The HPI is a valuation-based index that accounts for the mix of properties sold, giving a cleaner read on true capital value movement. A 2% quarterly rise in the HPI is more telling than a volatile median price swing.
- Days to Sell & Sales Volume: These are leading indicators of market temperature. Rising days to sell and falling volumes often precede price adjustments. In my experience supporting Kiwi companies, monitoring the ratio of sales to new listings provides an excellent gauge of buyer/seller balance.
- Rental Yield & Vacancy Rates: Calculate gross yield (annual rent/property value) and track it against long-term mortgage rates. Tenancy Services bond data provides invaluable suburb-level vacancy insights. A yield compressing below financing costs signals an investor-led price ceiling.
The Granular Layer: Geospatial & Comparative Analysis
This is where alpha is generated. National trends are meaningless; suburb and even street-level analysis is key.
- CV (Capital Value) vs. Sale Price Ratios: Analyse this by suburb over time. A rising ratio indicates accelerating demand in that specific area. Councils provide this data, and savvy analysts map it.
- Geospatial Mapping: Overlay sales data with new infrastructure maps (e.g., CRL in Auckland, Let's Get Wellington Moving projects), school zones, and flood plains. Value uplift is rarely evenly distributed.
How NZ Readers Can Apply This Today: Immediately create a simple dashboard tracking these three layers. For your target region, pin the latest OCR, net migration figures, REINZ HPI, and days to sell. This 10,000-foot view will immediately contextualise any individual property assessment.
A Strategic Framework for Decision-Making: The Property Analyst's Canvas
Data points are isolated stars; a framework forms the constellation. I advocate for a combined model approach.
1. The SWOT-PESTLE Hybrid Analysis
Go beyond a basic SWOT. Integrate PESTLE (Political, Economic, Social, Technological, Legal, Environmental) factors into each quadrant for a 360-degree view of an asset or market.
- Strength (Political): Property is in a zone earmarked for high-density development under the NZ National Policy Statement on Urban Development.
Weakness (Environmental):
- LIM report identifies increasing coastal erosion risk, affecting long-term insurability.
- Opportunity (Social): Proximity to a new tech hub attracting high-income migrants, as per Stats NZ regional employment data.
- Threat (Legal): Potential for new council levies on investor properties to fund infrastructure.
2. The 2x2 Investment Prioritisation Matrix
Plot potential suburbs or assets on a matrix. A powerful model uses Growth Potential (Y-axis) against Risk/Volatility (X-axis).
- High Growth, Low Risk (Stars): Established suburbs adjacent to major transport upgrades. The data shows consistent yield and CV growth with low sales volatility.
- High Growth, High Risk (Question Marks): Emerging fringe suburbs. Migration and development consent data is positive, but sales volumes are low, leading to price volatility.
- Low Growth, Low Risk (Cash Cows): Stable, high-yield rental suburbs in provincial centres. Perfect for cash flow portfolios.
- Low Growth, High Risk (Dogs): Areas with declining population stats and rising days to sell. Avoid or divest.
Drawing on my experience in the NZ market, I've used this matrix with developer clients to rationally allocate capital across their land bank, often challenging emotionally held "trophy" sites with hard data.
Case Study: Kainga Ora – Leveraging Data for Large-Scale Portfolio Strategy
Problem: As New Zealand's public housing provider, Kainga Ora manages a vast, ageing portfolio spread across diverse markets. The challenge was strategic: where to prioritise redevelopment, maintenance, and new acquisitions to maximise social impact and long-term asset sustainability within tight fiscal constraints. Relying on outdated needs assessments or political pressure was inefficient.
Action: Kainga Ora developed a sophisticated data-driven "Place-based Strategy." They integrated Stats NZ demographic data, MBIE building consent and deprivation index figures, Health NZ statistics, their own tenancy turnover and maintenance cost data, and local council planning maps. This created a dynamic model identifying suburbs with the highest concentration of housing need, coupled with the economic and infrastructural viability for large-scale, mixed-use development.
Result: This analytics-led approach allowed for:
- Precision Targeting: Redirecting billions in investment to areas with the highest measurable social return (e.g., Mangere, Porirua).
- Improved Portfolio ROI: By understanding localised maintenance costs vs. redevelopment benefits, they optimised life-cycle spending.
- Stakeholder Alignment: Using clear data to justify decisions to central government and communities.
Takeaway: The scale is unique, but the principle is universal. Whether managing a portfolio of two properties or two hundred, integrating socio-economic, maintenance, and planning data creates a robust, defensible strategy that outperforms intuition. Kiwi investors can emulate this by building a simple model that scores suburbs based on their personal criteria (yield, growth, depreciation, school zones).
Debunking Common Myths: The Data Doesn't Lie
Let's dismantle three pervasive myths that cloud judgment in the NZ market.
Myth 1: "A rising median price means my property is gaining value at the same rate." Reality: The median price is dangerously simplistic. It can be skewed by a surge in sales of either premium or entry-level homes in a given period. The REINZ HPI is a far more accurate measure of value change for a typical property. In Q4 2023, the national median price might show a slight dip, while the HPI indicated stabilisation, revealing a market shifting toward more mid-range sales.
Myth 2: "High rental yield always equals a great investment." Reality: A sky-high yield (e.g., >8%) often compensates for high risk—such as in areas with volatile tenancy demand, poor quality housing stock, or low capital growth. Conversely, a 3% yield in a premium suburb may be coupled with 7% annual capital growth. The key metric is total return (yield + growth), adjusted for risk. Data from interest.co.nz's yield tables must be cross-referenced with long-term CV growth rates from QV.
Myth 3: "This boom/bust cycle is just like the last one." Reality: Every cycle has a unique fingerprint. The 2021-22 boom was fuelled by record-low OCR and quantitative easing. The subsequent correction was shaped by the fastest OCR hiking cycle in history and record migration. Relying on the "pattern" of the 2008 GFC or the mid-2010s boom is a strategic error. You must analyse the unique drivers of the current phase, not just the price curve.
The Controversial Take: Why Your "Location, Location, Location" Mantra is Incomplete
For decades, location has been the holy trinity. I argue that in today's data-rich environment, the mantra should be "Location, Timing, and Data Validation." A superb location bought at the peak of an irrational cycle can be a terrible investment. Through my projects with New Zealand enterprises, I've seen more wealth destroyed by impeccable locations purchased at the wrong time than by mediocre locations acquired strategically.
The industry secret? Top fund managers and developers have a disciplined, non-negotiable buying framework. They define precise, data-triggered entry and exit criteria before they fall in love with an asset. For example: "We will only acquire in Suburb X if the 12-month rolling sales volume increases by 10% AND the median Days to Sell falls below 30, indicating renewed demand momentum." This removes emotion and anchors decisions in observable market mechanics.
Prediction: Over the next five years, access to granular, real-time data (from energy efficiency ratings to micro-local amenity scores) will become commoditised. The competitive edge will shift entirely to the quality of the analytical framework and the discipline to execute it without emotion.
Future Trends: The Next Frontier in Property Analytics
The analysis toolkit is evolving rapidly. To stay ahead, monitor these developments:
- AI-Powered Predictive Valuation Models: Beyond automated valuations, look for models that ingest planning documents, news sentiment, and infrastructure timelines to forecast value uplift probabilities for specific streets.
- Climate Risk Integration: With EQC and private insurer data becoming more accessible, flood, slope, and coastal hazard ratings will be quantitatively priced into valuation models, creating a stark divide between resilient and at-risk assets.
- ESG Scoring for Residential Assets: Tenants and buyers will increasingly value verified sustainability metrics. A Home Energy Rating System (HERS) score or a building's whole-life carbon footprint will move from a niche concern to a core value driver, influenced by both market demand and potential regulatory changes like the Climate-Related Disclosures regime.
Based on my work with NZ SMEs in proptech, the firms building platforms to aggregate and simplify access to these disparate data streams are the ones to watch.
Final Takeaway & Your Strategic Action Plan
Navigating New Zealand's property market without a data framework is tactical gambling, not strategic investing. The gap between those who react to headlines and those who anticipate shifts based on layered analysis will only widen.
Your action plan starts this week:
- Build Your Dashboard: Create that one-page macro/market overview for your target regions.
- Adopt One Framework: Implement either the SWOT-PESTLE or the 2x2 Matrix for your next property evaluation. Do it on paper. Force yourself to fill in each box with a verifiable data point, not an opinion.
- Interrogate One Assumption: Re-examine a property or suburb you're interested in. Challenge one piece of "common knowledge" about it. Find the data that proves or disproves it.
The goal is not to become a full-time data scientist, but a strategically literate decision-maker. In a market where a 5% misstep can represent hundreds of thousands of dollars, the ROI on cultivating this analytical discipline is incalculable.
Ready to move beyond intuition? I challenge you to apply one framework from this guide to your next property decision and share the difference it made. Did it confirm your hunch, or did it reveal a hidden risk or opportunity you had missed? The conversation starts with data.
People Also Ask (PAA)
What is the most important property market data point for NZ investors to watch? While no single point suffices, the REINZ House Price Index (HPI) combined with the RBNZ's OCR track are critical. The HPI shows true value movement, while the OCR direction sets the financing cost environment for all market participants.
How can I access reliable property data for free in New Zealand? Start with official sources: REINZ and QV for sales data and indices, Stats NZ for demographic and economic data, Tenancy Services for bond data (rental trends), and your local council's GIS portal for planning maps, CVs, and hazard information. These provide a robust, free foundation.
What's a common data analysis mistake made by first-time property investors? The biggest mistake is extrapolating national or city-wide trends to a specific suburb or property type. A market may be "cooling" overall, but certain suburbs with unique demand drivers (e.g., new school, transport link) can be strongly appreciating. Always drill down to the most granular data available.
Related Search Queries
- REINZ HPI vs median price New Zealand
- How to calculate gross rental yield NZ
- Stats NZ migration data property market impact
- New Zealand suburb growth projections 2024
- Commercial property valuation methods NZ
- Climate change risk property valuation New Zealand
- Kainga Ora place-based strategy data
- Best property market analysis tools for Kiwi investors
For the full context and strategies on How to Analyze NZ Property Market Data for Smarter Decisions, see our main guide: New Zealand Beauty Personal Care.