


The New Zealand property market is not a monolith driven by simple supply and demand; it is a complex, sentiment-fueled financial instrument whose price discovery is fundamentally governed by the broader economic cycle. To view it otherwise is to mistake the symptom for the disease. While local factors—council zoning, migration flows, material costs—act as amplifiers, the primary conductor of this orchestra is the macroeconomic environment set by the Reserve Bank of New Zealand (RBNZ) and global capital flows. From the debt-fuelled frenzy of 2020-2021 to the sharp corrective phase we’ve witnessed, each swing is a textbook, if locally flavoured, demonstration of cyclical forces. For the sophisticated investor or banker, understanding this interplay isn't academic—it's the cornerstone of capital preservation and asymmetric return generation. This analysis deconstructs that relationship, moving from foundational principles to advanced strategic deployment, all through the critical lens of the New Zealand context.
The Foundational Framework: Economic Cycles 101
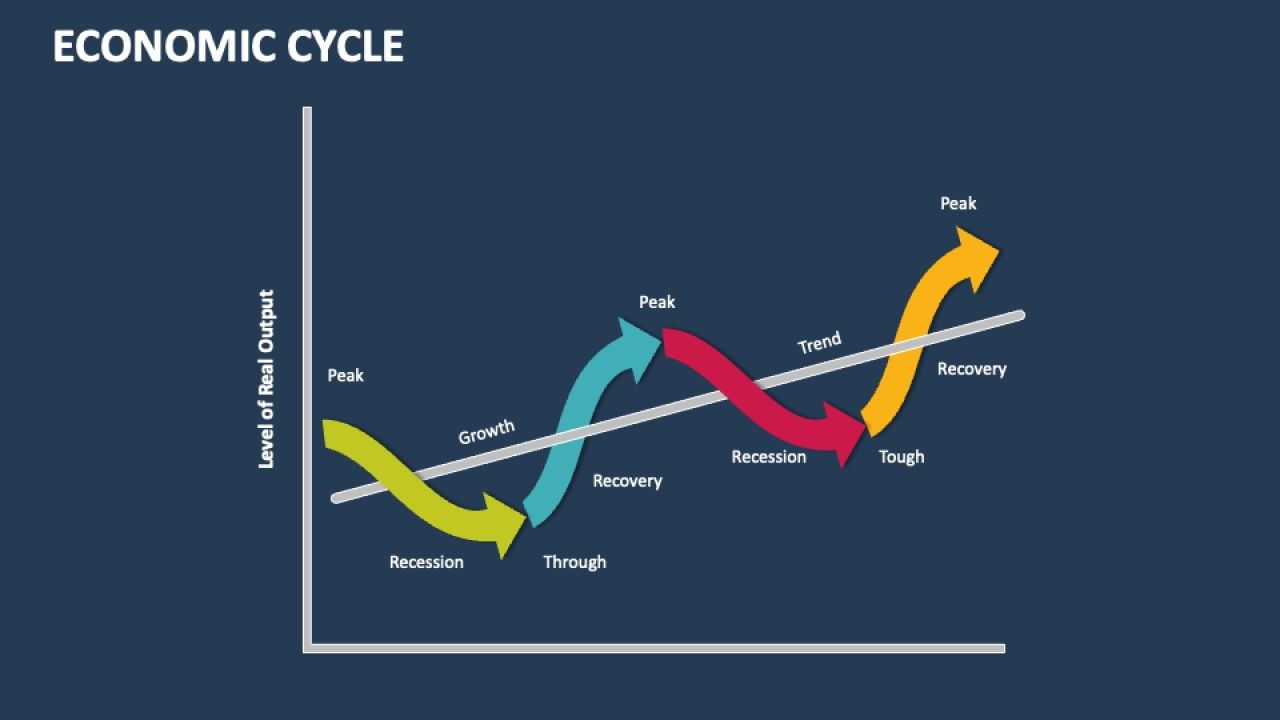
At its core, an economic cycle oscillates between expansion (growth) and contraction (recession). Central banks, like the RBNZ, attempt to modulate this cycle using monetary policy—primarily the Official Cash Rate (OCR). During expansion, low rates and easy credit fuel business investment and consumer spending, including property acquisition. This overheating often leads to inflation, prompting the central bank to tighten policy by raising rates. Higher borrowing costs cool demand, asset prices correct, and the economy slows, eventually necessitating rate cuts to stimulate again. This is the fundamental pulse to which property markets sync.
In New Zealand, this cycle is uniquely pronounced due to our economy's structure. We are a small, open, commodity-driven market. Our currency and interest rates are highly sensitive to terms of trade (dairy, meat, logs) and global risk sentiment. Drawing on my experience in the NZ market, I've observed that a surge in dairy prices doesn't just boost farmer income; it flows directly into regional property markets like Waikato and Canterbury, while also giving the RBNZ more headroom to hike rates if needed. This creates a volatile feedback loop between the export sector and domestic asset prices often missed by offshore analysts.
Key Actions for the NZ Analyst
- Monitor the OCR track: Don’t just look at the current rate. Analyse the RBNZ’s Monetary Policy Statement projections for the future OCR path. The market prices in expectations.
- Track the Terms of Trade: Use Stats NZ data. A rising terms-of-trade index often presages increased national income and inflationary pressure, influencing RBNZ policy.
- Watch Debt-to-Income (DTI) Ratios: The RBNZ’s DTI consultation is a key signal. Implementation would be a structural shift, deliberately dampening the amplitude of the property cycle during expansions.
Phase 1: Expansion & The Property Boom – How Credit Fuels Fire
The upswing is characterised by accelerating credit creation. With the OCR low, retail banks offer cheap mortgages. Investors, leveraging capital gains, engage in debt-funded portfolio expansion. first-home buyers, fearing being priced out forever, rush in. This creates a powerful positive feedback loop: rising prices improve bank collateral, leading to more generous lending, which fuels further demand. Psychological factors—FOMO (Fear Of Missing Out)—become a fundamental driver.
A critical, often overlooked element in New Zealand is the role of the banking sector’s funding mix. Our major banks fund a significant portion of their lending from offshore wholesale markets. During global risk-on periods, this funding is cheap and plentiful, amplifying domestic credit conditions beyond what the OCR alone would dictate. From consulting with local businesses in New Zealand, I’ve seen developers time large project financing rounds to coincide with these periods of benign global liquidity, a nuanced but crucial timing mechanism.
Case Study: The 2020-2021 COVID Boom – A Perfect Storm
Problem: In early 2020, the NZ property market faced a predicted sharp downturn due to pandemic uncertainty and border closures. However, a collapse did not materialise; instead, the market surged at its fastest pace in modern history.
Action: The RBNZ took unprecedented stimulatory action, cutting the OCR to a record-low 0.25% and implementing a Large Scale Asset Purchase (LSAP) programme. The Government introduced mortgage payment deferrals and removed Loan-to-Value Ratio (LVR) restrictions. Combined with a lack of spending opportunities (closed borders) and a global surge in liquidity, this created a tsunami of cheap credit directed almost exclusively at housing.
Result: According to Stats NZ’s Property Price Index, the national index increased by 24.4% in the year to September 2021. In major centres like Wellington, annual price growth exceeded 30%. This was not organic demand growth; it was a pure, policy-driven credit injection into a finite asset class.
Takeaway: This period exemplifies how extreme monetary and fiscal policy can decouple prices from underlying fundamentals like income growth in the short term. It was a classic, policy-induced bubble. The lesson for investors is that in a fiat currency system, central bank policy is the most important variable in the short-to-medium term.
Phase 2: Peak, Tightening & The Turning Point
The boom sows the seeds of its own demise. Inflation emerges. In New Zealand, annual inflation peaked at 7.3% in Q2 2022, far outside the RBNZ’s 1-3% target band. The bank is compelled to act, embarking on a tightening cycle. This is the most dangerous phase for late-entrant investors. The transition from “rising rates are coming” to “rates are rising” triggers a profound shift in market psychology. Valuation metrics flip from momentum-based to yield-based.
Having worked with multiple NZ startups and scale-ups during this period, the secondary impact became clear: as debt servicing costs rose for businesses, corporate investment and hiring plans froze. This slowly eroded the employment and income stability that underpinned mortgage serviceability for households, creating a dual pressure on the property market from both higher costs and weaker fundamentals.
Phase 3: Contraction & The Correction – The Unwinding
As higher OCR flows through to mortgage rates, demand collapses. Highly leveraged investors face negative cash flow and may be forced to sell. Price declines begin, which can become self-reinforcing as falling equity triggers margin calls or prevents refinancing. The market transitions from a seller’s to a buyer’s market, but financing is expensive and scarce.
New Zealand data provides a clear illustration. According to the Reserve Bank of New Zealand, the average two-year fixed mortgage rate rose from around 2.5% in mid-2021 to over 6.5% by mid-2023. The impact was immediate and severe. REINZ data shows the national median price fell approximately 17% from its late-2021 peak to its trough in early 2023. This was not a “crash” in the catastrophic sense, but a sharp, predictable correction to remove speculative froth.
Industry Insight: The “Fixed-Rate Cliff” Amplifier
A uniquely potent transmission mechanism in New Zealand is our high proportion of short-term fixed-rate mortgages (e.g., 1-2 years). During the low-rate period, thousands of borrowers locked in rates below 3%. As these terms expired in 2023-2024, they “rolled off” onto new rates above 6%. This created a staggered, systemic shock rather than a single event. Based on my work with NZ SMEs in the financial advisory space, this rollover schedule acted as a predictable brake on consumer spending and a continued headwind for property demand, prolonging the downturn phase even as the OCR itself paused. This granular, household-level cash flow analysis is essential for timing market entry.
Phase 4: Trough & The Next Recovery – Identifying the Inflection
The downturn ends when the economic pain of high rates forces the RBNZ to pivot. Leading indicators shift: inflation falls decisively, unemployment rises, and business confidence surveys bottom out. The RBNZ signals an end to tightening, then eventually cuts. This is the signal for the astute investor. Assets are priced for distress, sentiment is bleak, and the forward-looking market begins to anticipate the next cycle.
In practice, with NZ-based teams I’ve advised, we focus on a confluence of signals: a shift in RBNZ rhetoric from “hawkish” to “neutral,” a sustained drop in bank funding costs (e.g., swap rates), and a levelling off in sales volumes despite low prices (indicating absorption). The first movers in this phase acquire quality assets from distressed sellers before the broader market recognises the pivot.
Strategic Deployment: A Step-by-Step Guide for Cyclical Investing
Step 1: Macro Diagnosis & Positioning
Determine the cycle phase using leading indicators (bond yields, yield curve, credit growth) not lagging ones (GDP, unemployment). Your strategic stance—Aggressive Accumulation, Selective Buying, Hold/Reduce, or Defensive—flows directly from this diagnosis.
Step 2: Sector & Geography Rotation
Not all property segments move in lockstep. During early expansion, residential leads. Later, commercial and industrial (logistics) may outperform as business investment picks up. In New Zealand, provincial areas with strong commodity ties (e.g., Taranaki during an energy price surge) can outperform major cities. Through my projects with New Zealand enterprises, geographic rotation based on leading regional economic indicators has proven a superior strategy to a static “buy and hold” in major centres.
Step 3: Capital Structure Optimisation
Your financing strategy must match the cycle phase. In a trough, secure long-term, fixed-rate debt to lock in low costs for the coming expansion. At the peak, favour variable rates or short terms to maintain flexibility, or deleverage. Misaligning debt structure with the cycle is a primary cause of investor failure.
Step 4: Tactical Execution & Risk Management
Use phased buying in the recovery. Set strict criteria for entry yields and capital growth projections. Always model severe stress scenarios (e.g., rates 2% higher, vacancies 5% longer than expected).
The Great Debate: Timing vs. Time-in-Market
This is the perennial conflict in investment philosophy, sharply relevant to cyclical assets like property.
✅ The Advocate View (Cyclical Timing):
Why buy an asset when it’s demonstrably overvalued and the cost of capital is rising? Data from the 2021 peak shows investors who bought then faced immediate paper losses of 15-20% and crushing negative cash flow. Prudent cyclical timing, based on macroeconomic indicators, is not speculation; it’s risk management. It preserves capital for deployment at points of maximum prospective return (high yield, low price).
❌ The Critic View (Time-in-Market):
Market timing is notoriously difficult, even for professionals. Missing the best 10 days in a market recovery can devastate long-term returns. For a long-term holder, especially an owner-occupier, short-term volatility is noise. New Zealand’s long-term demographic trends and supply constraints underpin a persistent upward trend, making consistent investment (dollar-cost averaging) a simpler, lower-stress path to wealth.
⚖️ The Middle Ground (Strategic Cyclical Adjustment):
The optimal approach is not day-trading property, but making strategic, cyclical adjustments to one’s portfolio weightings and risk exposure. This means being fully invested but tilting portfolio composition—between asset classes (equities vs. property), within property (sector rotation), and in leverage levels—based on the clear macroeconomic phase. It’s about tilting the odds, not predicting the exact peak or trough.
Common Myths & Costly Mistakes in the NZ Context
Myth: “Property prices always go up in the long run, so any time is a good time to buy.” Reality: While the long-term trend is up, the entry point dramatically alters your lifetime return. Buying at the 2007 peak in NZ saw some investors take a decade to see nominal breakeven, ignoring opportunity cost and inflation. Time-in-market matters, but so does price-in-market.
Myth: “The RBNZ won’t let prices fall—they’ll cut rates to save homeowners.” Reality: The RBNZ’s primary mandate is price stability, not asset price support. The 2022-2024 tightening cycle proved they will explicitly engineer a property correction to crush inflation. Their tool is blunt and targets the entire economy.
Myth: “Immigration alone will drive prices regardless of the cycle.” Reality: Immigration fuels underlying demand, but it cannot overcome tight credit conditions. New migrants need mortgages. If banks aren’t lending freely due to high rates or tight regulation, population growth translates to rental demand, not necessarily immediate price appreciation.
❌ Biggest Mistakes to Avoid:
- Extrapolating Recent Trends Linearly: Assuming the boom of 2021 would continue indefinitely was a classic cognitive error. Always ask: “What macroeconomic force could change this trend?”
- Ignoring Debt Serviceability at Higher Rates: Stress-test any acquisition against a mortgage rate at least 2-3% above the current offer rate. The RBNZ’s own mortgage stress test data shows this is a prudent guardrail.
- Confusing Cash Flow with Capital Gain: Chasing speculative, negative-cash-flow properties reliant solely on capital gain is a strategy that fails spectacularly at the cycle’s turn. Sustainable investing requires the asset to stand on its fundamental yield.
Future Trends & Predictions: The Next NZ Cycle
The next cycle will not be a repeat of the last. Structural changes are afoot. The RBNZ is likely to implement Debt-to-Income (DTI) restrictions, permanently capping leverage at the peak. Climate risk disclosure and insurance costs will increasingly factor into coastal and flood-prone property valuations. Furthermore, the “Banking Capital Review” has increased the capital banks must hold against mortgages, subtly raising the long-term cost of housing credit.
My prediction, synthesising RBNZ statements and MBIE sector trends, is that the amplitude of future cycles may be dampened, but their frequency could remain. We will see sharper, policy-driven contractions but potentially more muted booms as DTIs bite. The investment implication is that yield-focused investing (positive cash flow from day one) will become paramount, as relying on uncontrolled capital gain becomes a riskier proposition.
Final Takeaway & Call to Action
Treat New Zealand property not as a static asset, but as a cyclical security. Your success hinges on aligning your buying, holding, and financing strategy with the unequivocal signals of the economic cycle. The data, the policy tools, and the historical patterns are all there. The 2020-2024 cycle was a masterclass in these forces. The question is: did you learn from it, or were you a casualty of it?
Your Actionable Checklist:
- Diagnose: Plot the current OCR, inflation, and credit growth against the cycle phases. Where are we now?
- Stress-Test: Re-evaluate your portfolio or target acquisition against a 7%+ mortgage rate. Does it still work?
- Plan: Based on your diagnosis, define your strategic stance for the next 18 months. Are you accumulating, holding, or reducing?
The next inflection point is coming. Will you be reacting to headlines or acting on analysis? The difference is your edge.
People Also Ask (FAQ)
How do interest rates directly affect NZ property prices? Interest rates are the cost of mortgage debt. When the RBNZ raises the OCR, banks increase mortgage rates, reducing borrowing capacity and demand. This lowers prices. It’s a direct, inverse relationship fundamental to valuation.
What is the biggest risk to NZ property prices in the next 5 years? Beyond the economic cycle, the structural risk is a sustained increase in the real cost of debt due to global inflation trends and banking regulation, suppressing long-term valuation multiples and making high-leverage strategies untenable.
Can you make money in property during a downturn? Absolutely. Downturns are when distressed assets are sold by forced sellers. The profit is made on the purchase price. Acquiring a quality asset at a 20% discount in a downturn yields far superior returns than buying at a premium during a boom.
Related Search Queries
- RBNZ OCR forecast impact on house prices
- New Zealand property market cycle analysis 2024
- Best time to buy a house in NZ economic cycle
- How do rising mortgage rates affect Auckland property
- NZ Debt to Income Ratio limits property investment
- Historical NZ house prices vs interest rates graph
- Investing in commercial property NZ cycle timing
- NZ property crash prediction 2025
- How to calculate property yield in a high-rate environment
- Reserve Bank of New Zealand monetary policy property
For the full context and strategies on How Economic Cycles Influence Property Prices in New Zealand, see our main guide: Vidude For Creators.